Welcome
Welcome to my page! You can find me at Bluesky or Mastodon. This is a collection of various little experiments, tutorials and explainers that I made. Mostly, these are made for fun for myself. I am happy though if any of the explainers could be helpful to someone! I like to write down math that I frequently use or am interested in, because, in my opinion, many source do not provide derivations or have only parts of it listed. So this is helpful to myself when I just want a refresher and writing something down also helps in understanding things! It is also fun to see how to include interactive elements into these.
Porting old pages to this new system is still a work in progress!
Resources
Rasterization
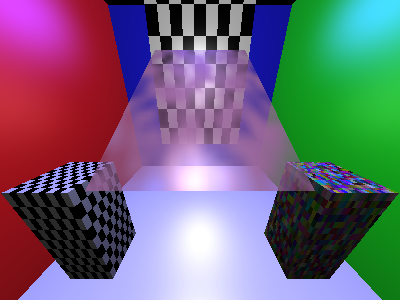
A full course on rasterization. We will build a rasterizer directly in the browser from drawing lines to full on 3D graphics!
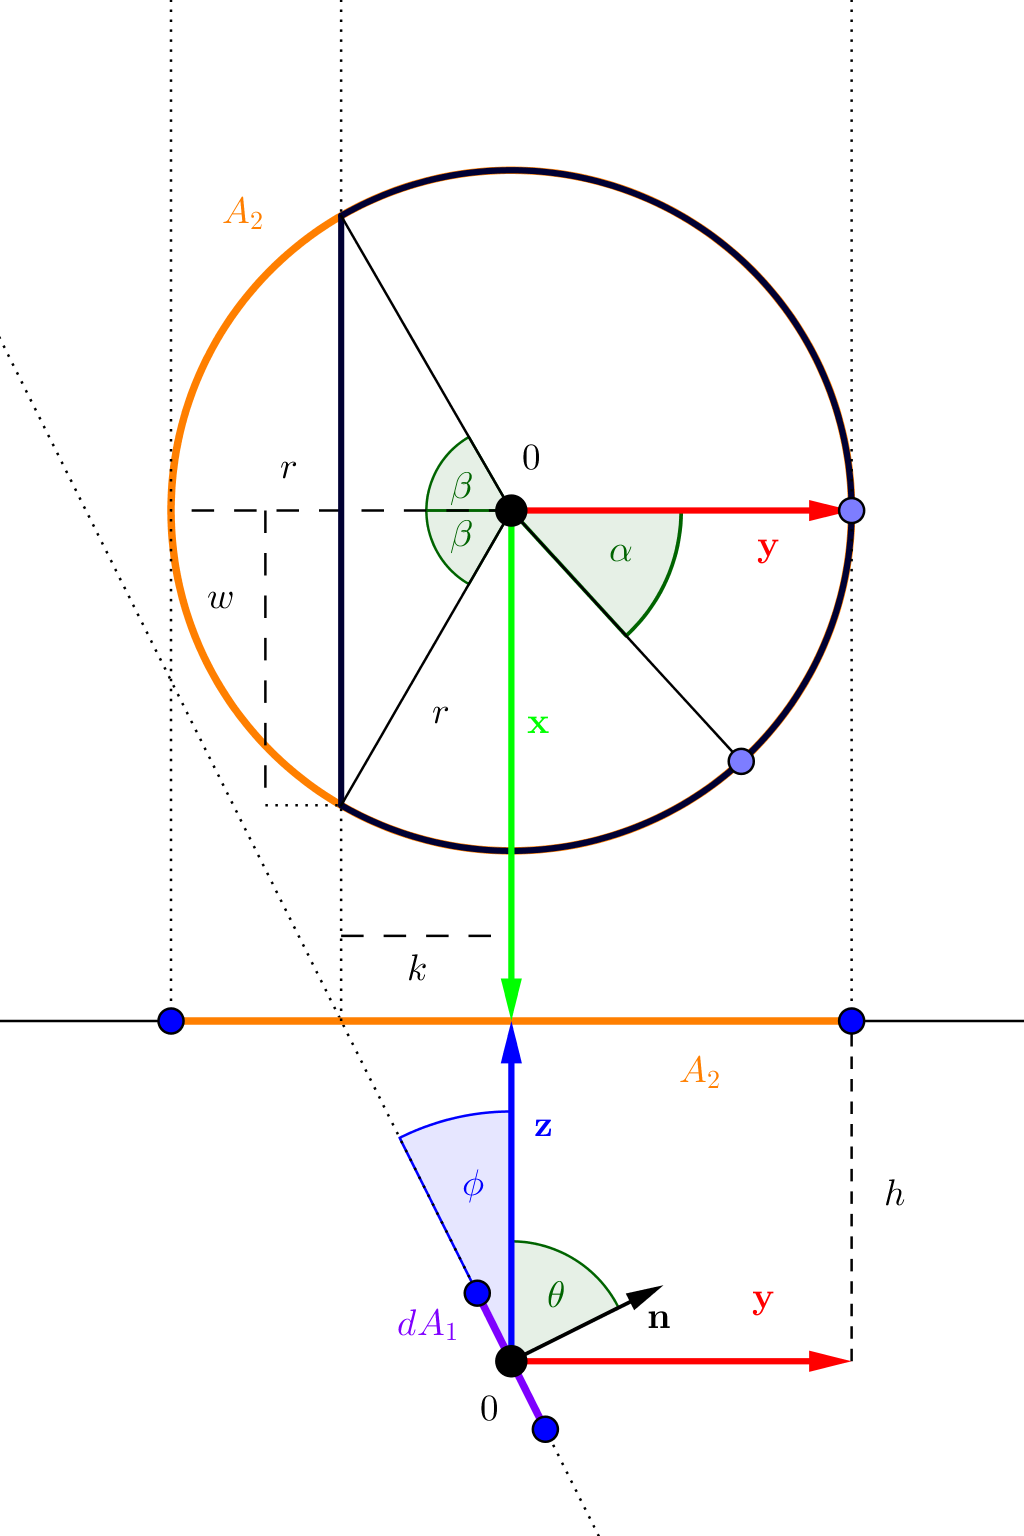
Sampling
A collection of some common sampling algorithms and derivations used in computer graphics, specifically path tracing.
Quaternions
Quaternions in the context of computer graphics and rotations are often said to be incomprehensible. This article tries to show how to get geometric meaning from the rotation formula using vector math.
Low-rank filter
Image filters are used in basically every application working with images. This article explores the idea of approximating 2D filters with a number of 1D filters for potential speed gains.
Translating math symbols to code
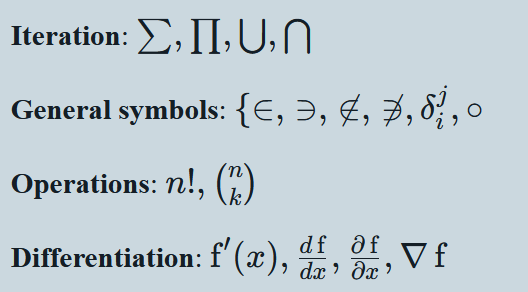
This article provides a few examples of how to read some common math symbols and how that translates into code. This is aimed at people unfamiliar with math but want to code.
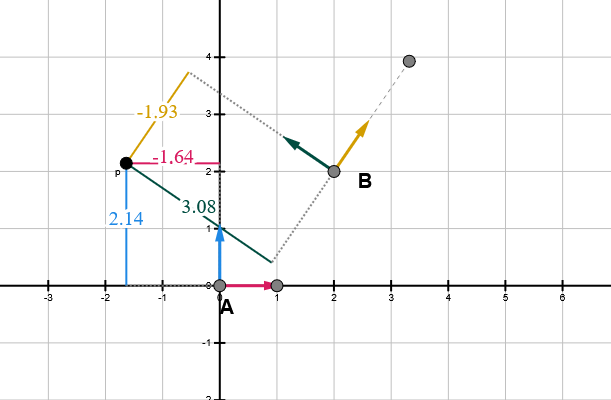
Applications of the dot product
The dot product is probably one of the most powerful tools in math (your mileage may vary). This article explores the dot product itself and some applications of its properties.
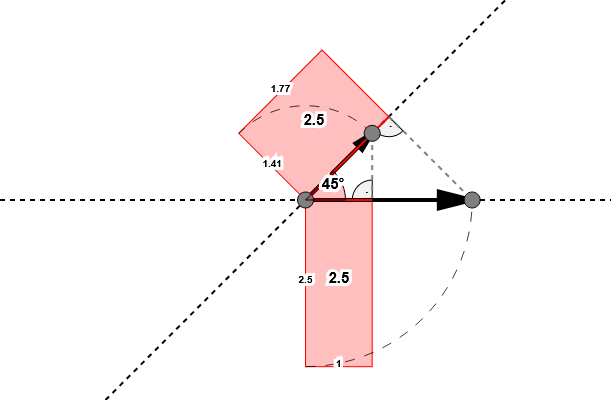
Coordinate transforms
Coordinate transforms are in every application that deals with objects in space (2D,3D,...). This article details the math of how to handle the common orthogonal frames encountered in robotics or computer graphics.
Bézier subinterval
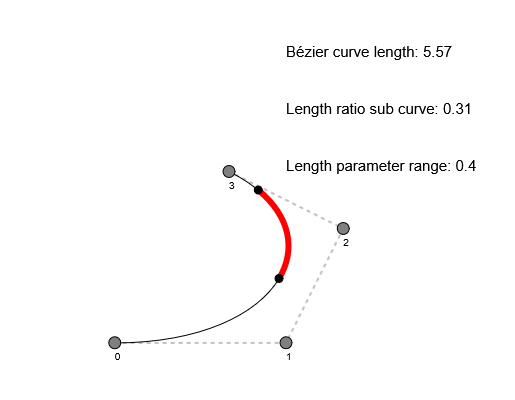
This article explores how to find a Bézier curve for a subinterval of the parameter space and how to derive it
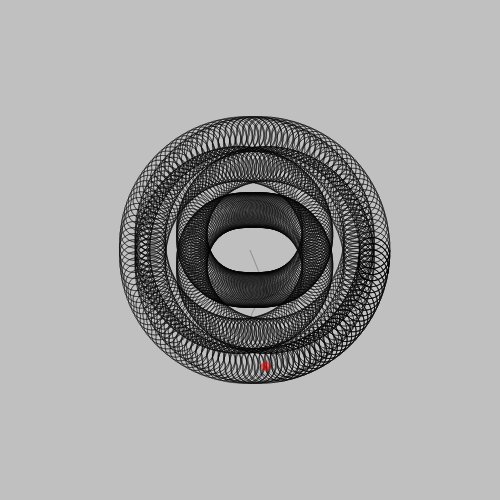
Complex Fourier Series
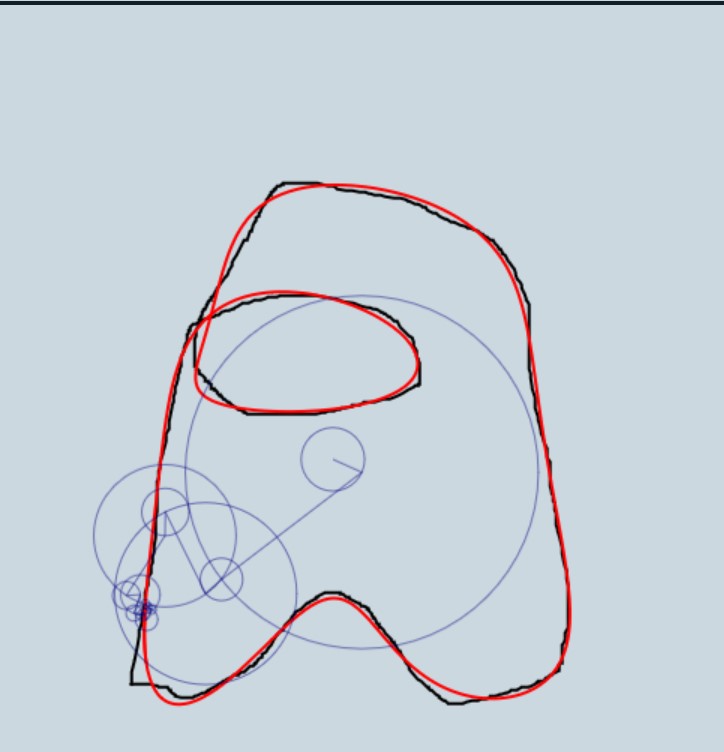
An example of how to visualize a complex 2D series as a curve. You can draw a curve and the approximation will trace it approximately!
Camera Ray Generation
How to get a ray from screen coordinates and a (view-) projection matrix. Includes a Shadertoy demo.
Playground
Algeobra Showcase
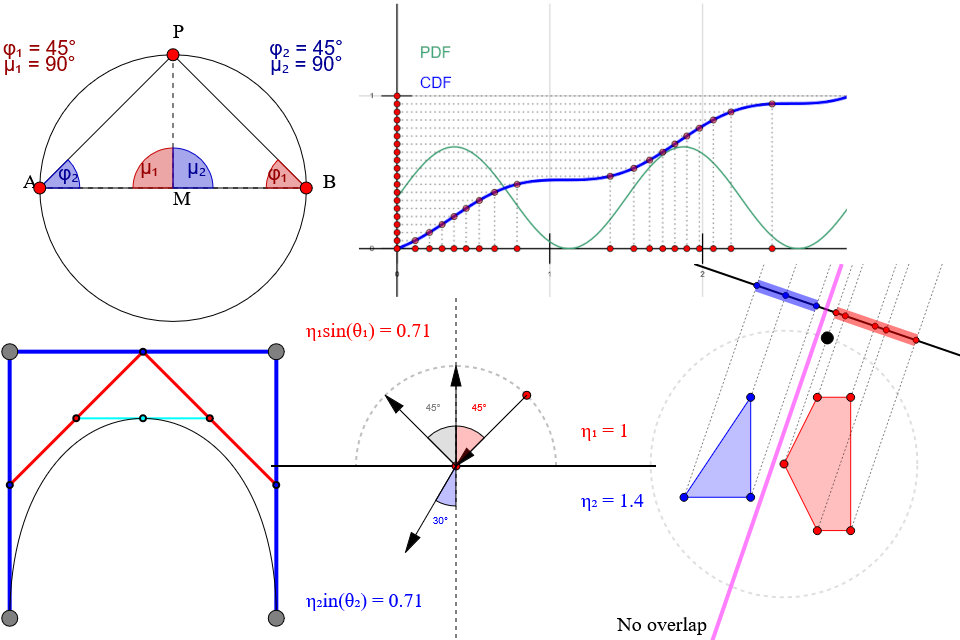
A showcase of various interactive visualizations made using my own Algeobra dynamic geometry library.
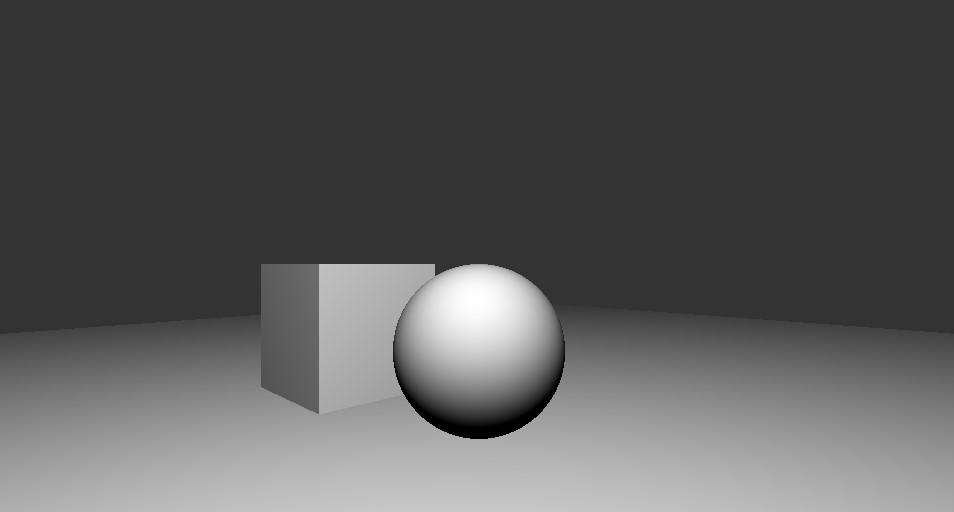
Geodesic Raytracer
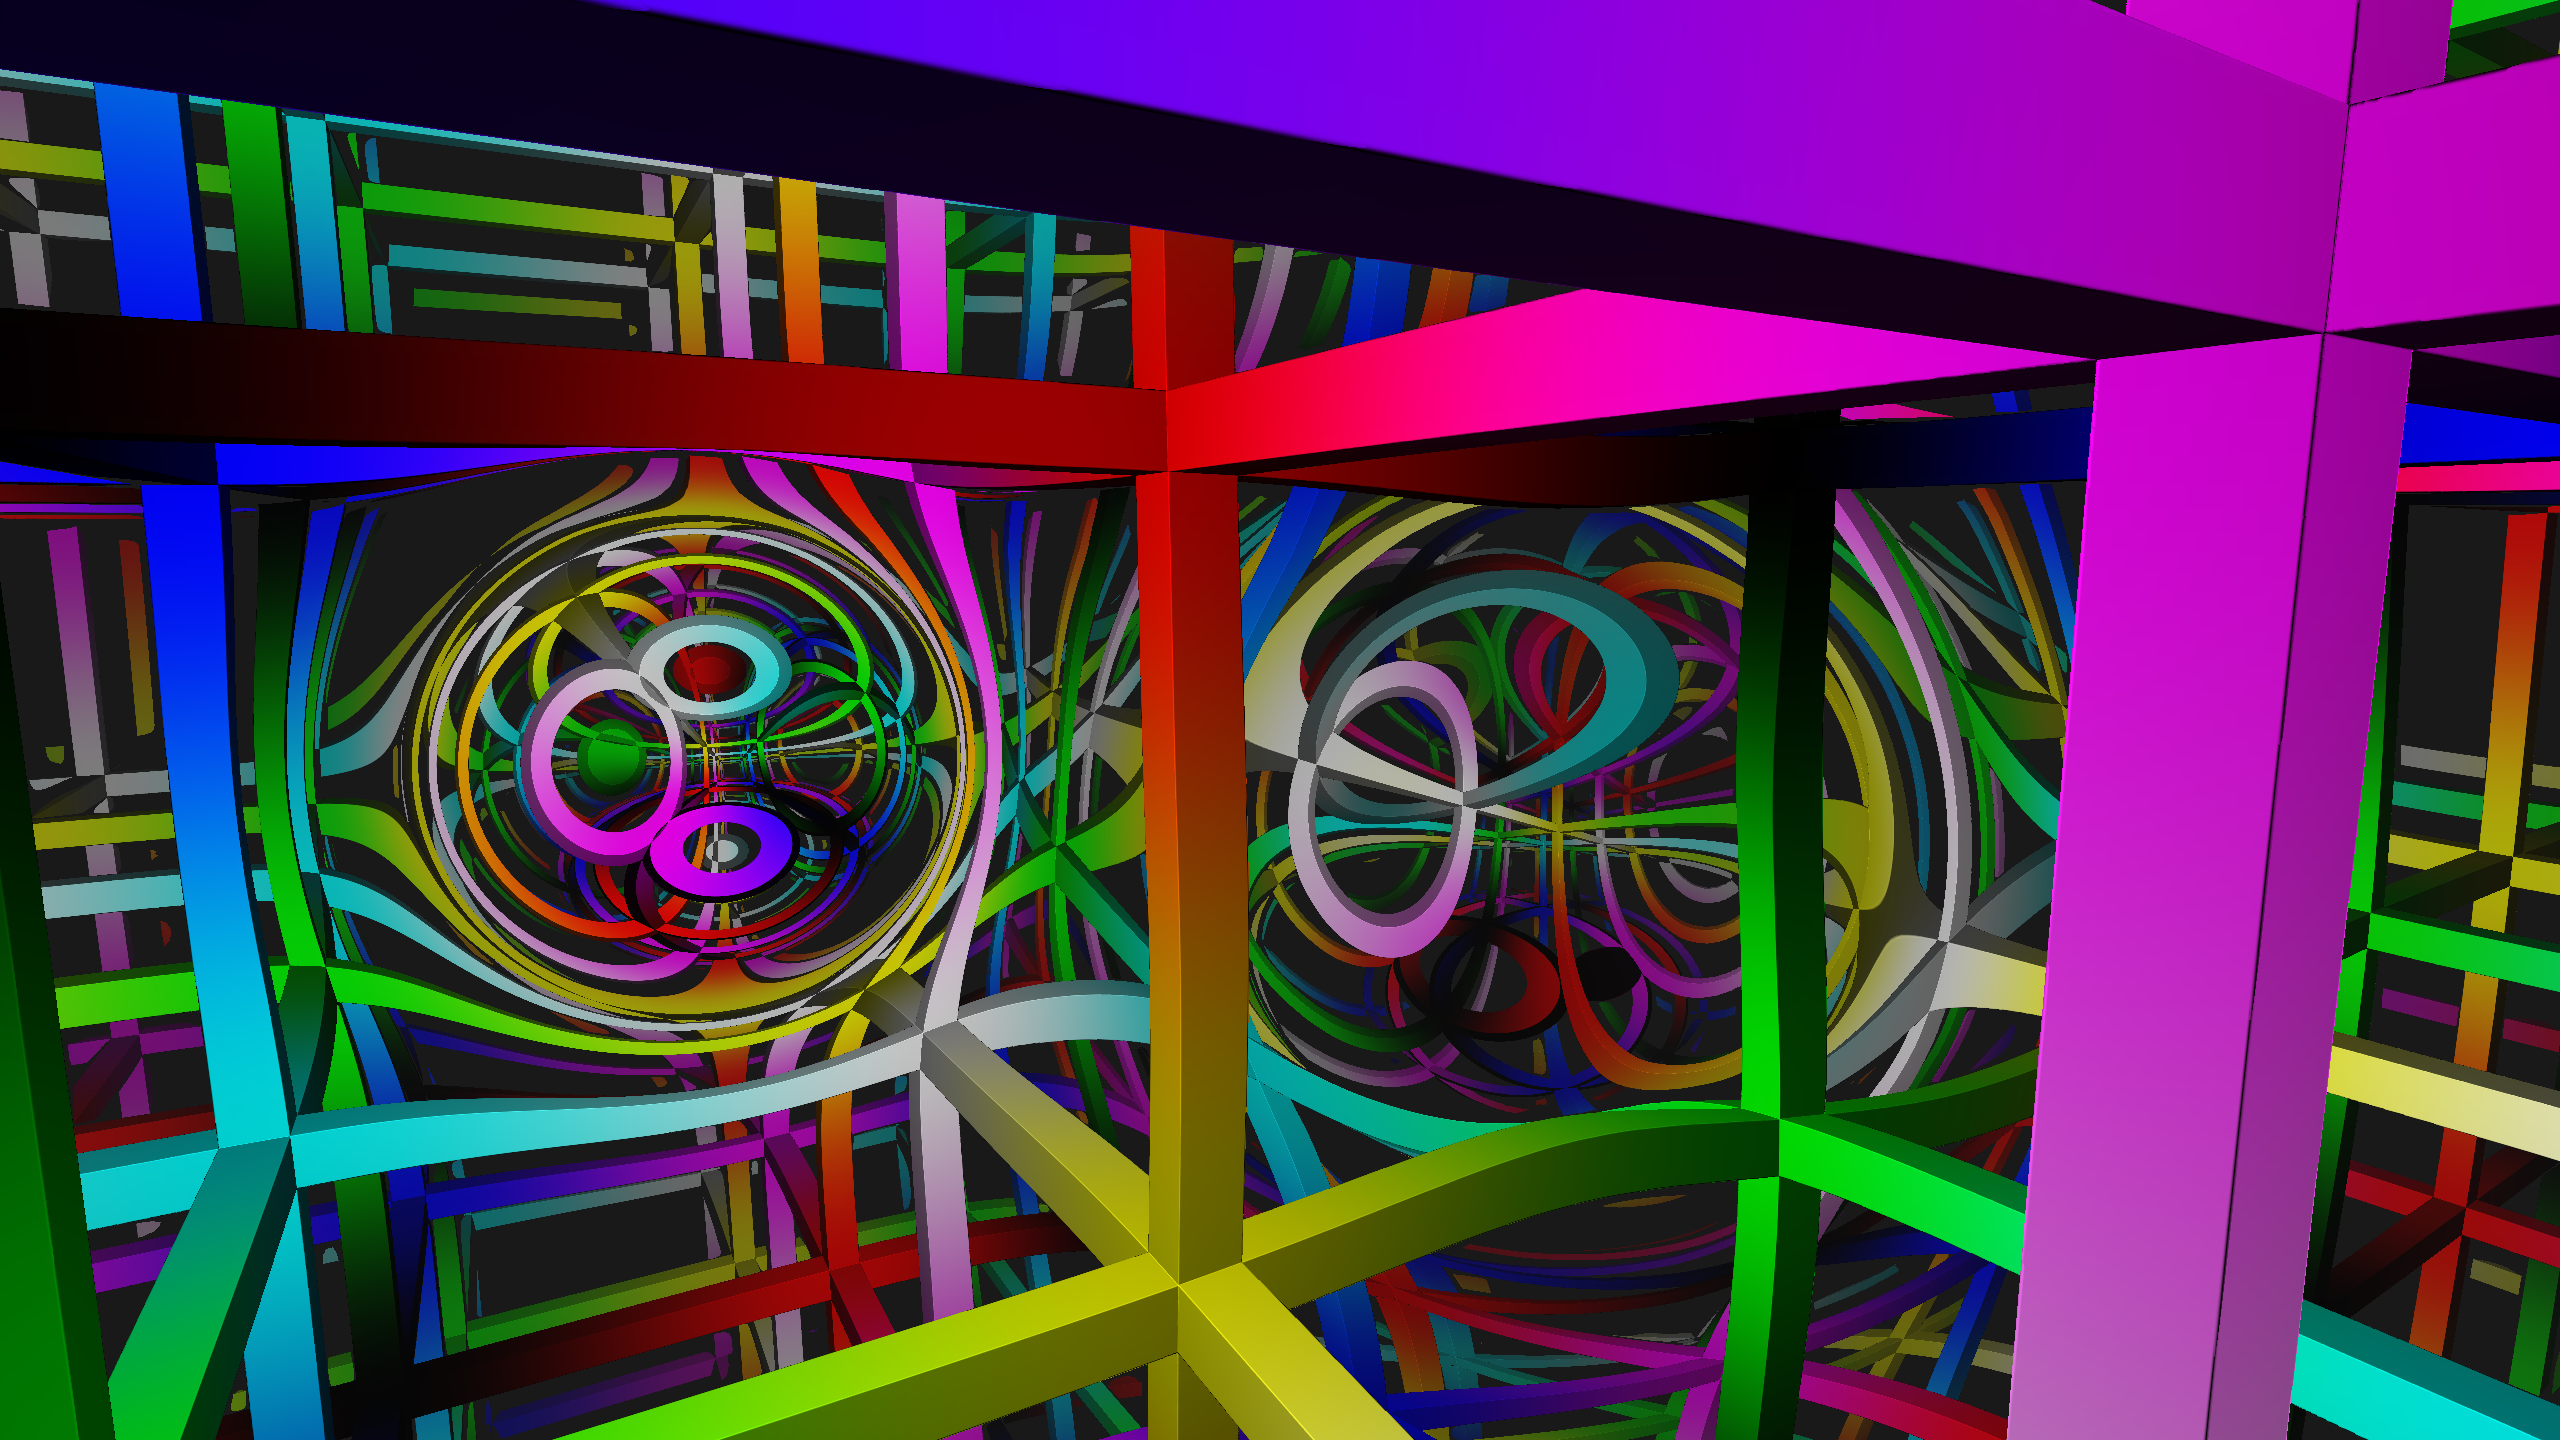
A raytracer going through curved space as a Shadertoy demo. Also includes explanation of the formulas being used.
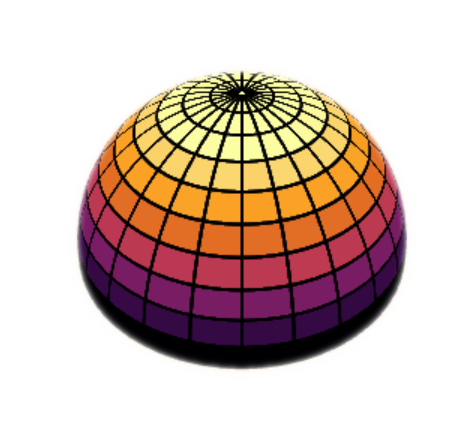
Curvature Visualization
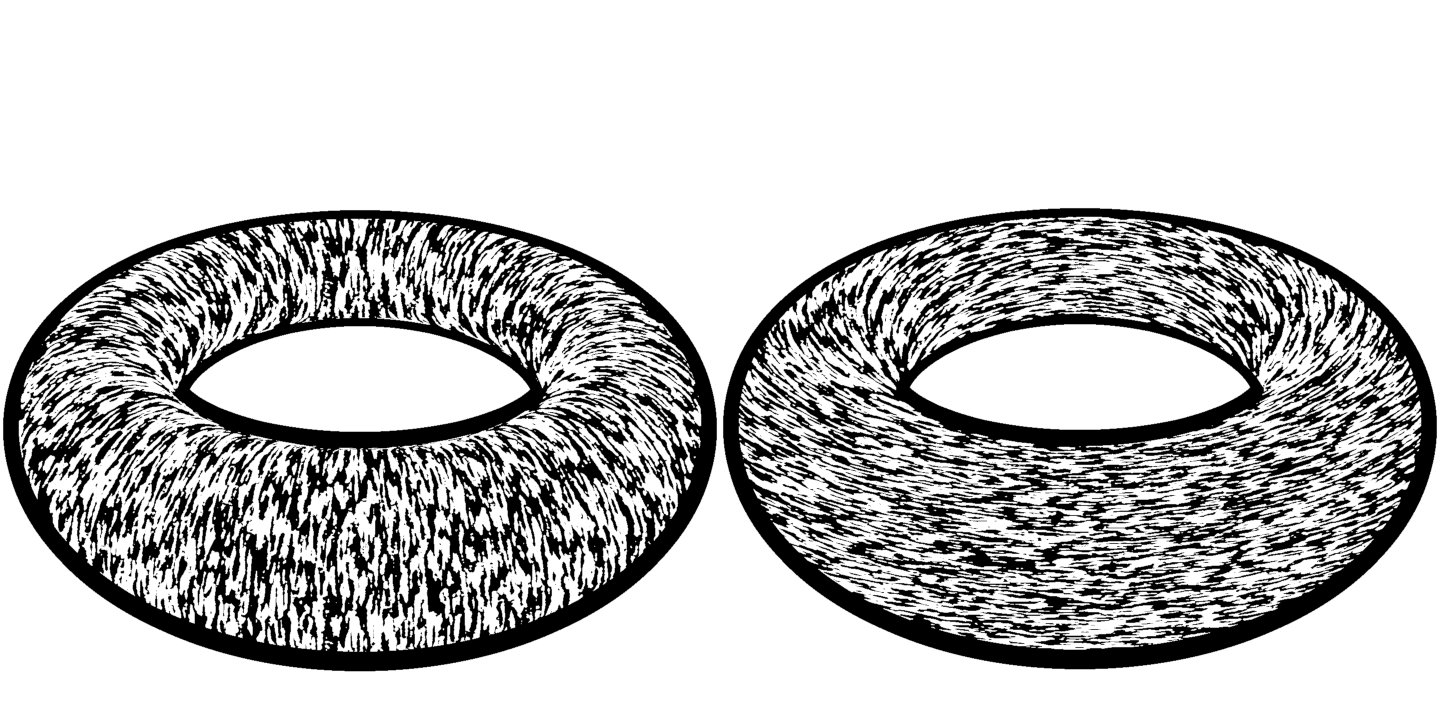
Visualizing principal and Gaussian curvature on distance fields and implicit surfaces.
2nd Order Implicit Distance Approximation
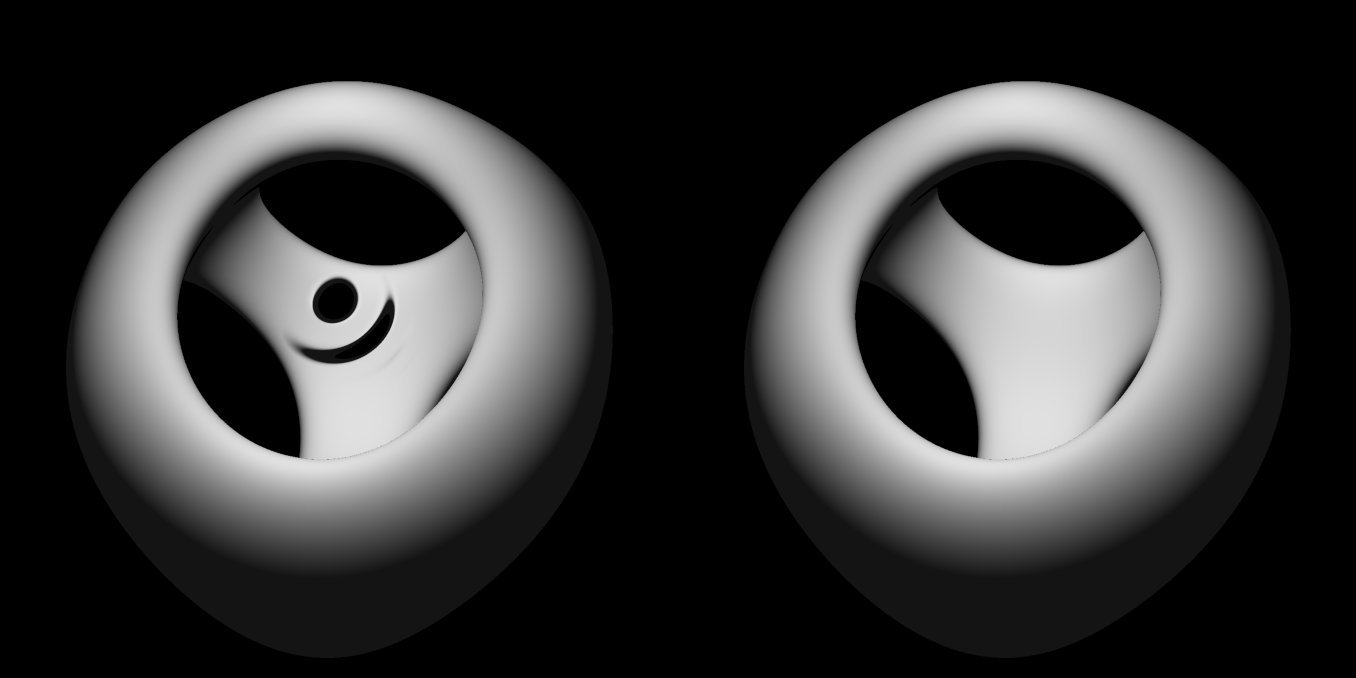
Example of approximating the distance to an implicit surface with a second order approximation.
Coordinate Stretching Visualization
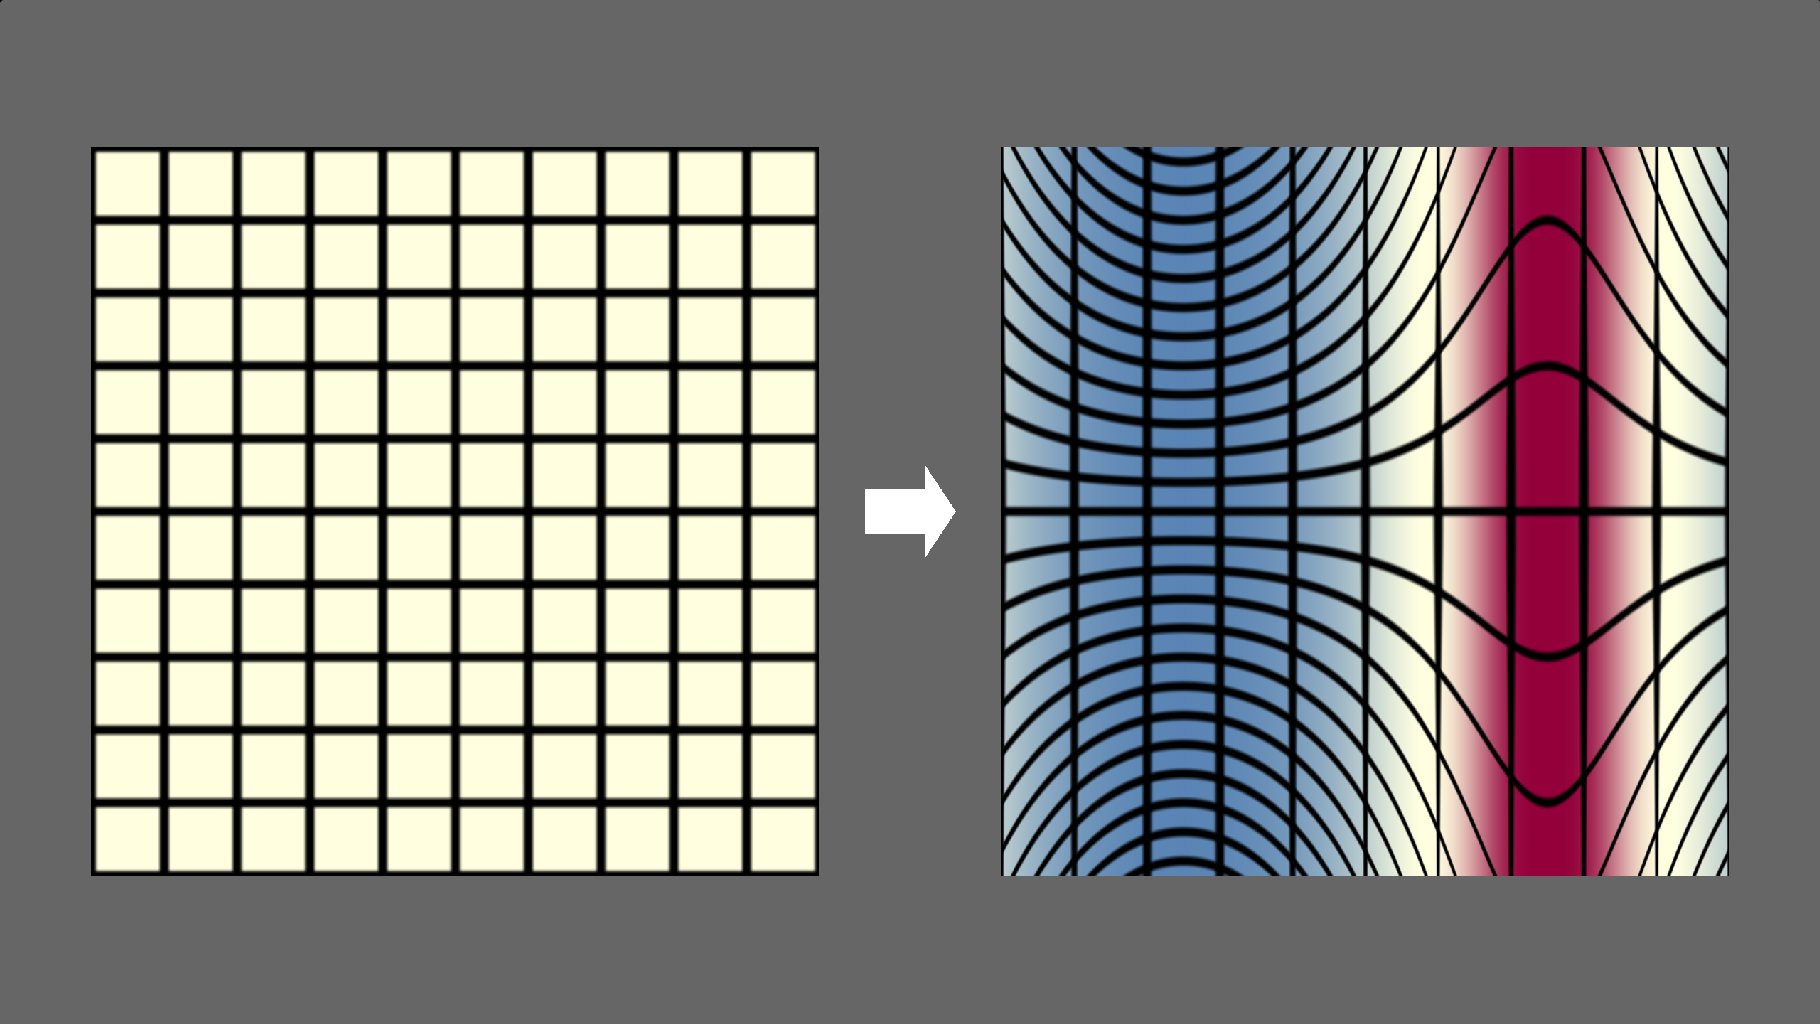
Visualizing the squishing and stretching that occurs when changing coordinates.
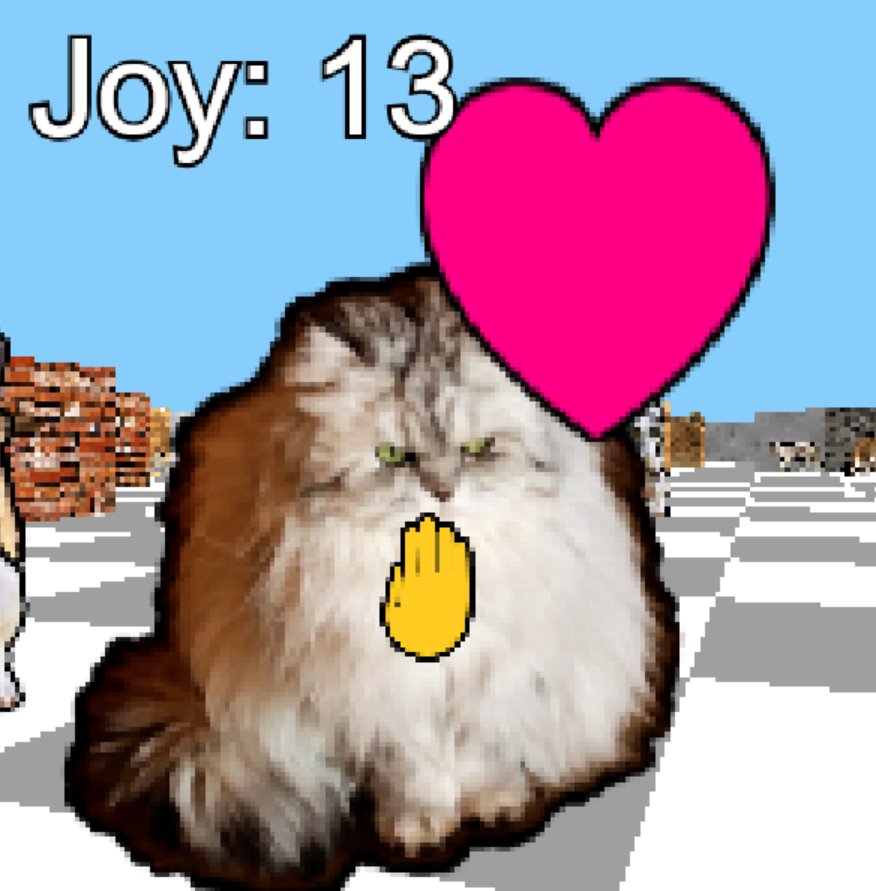
Evenly Matched Opponents
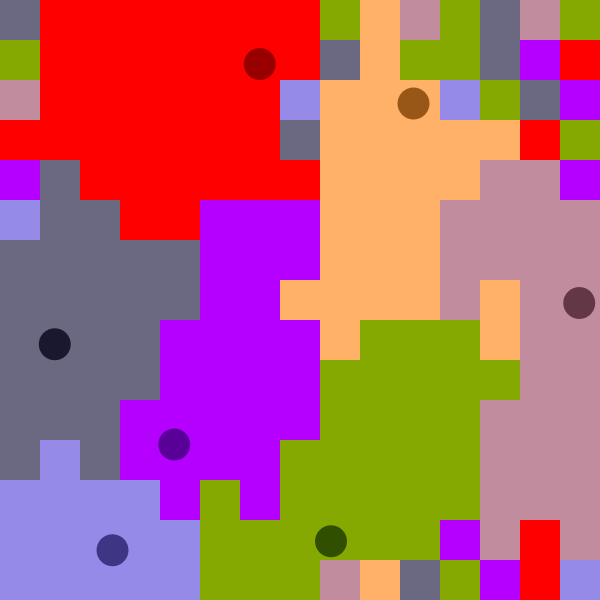
A simple self-running game about multiple opponents trying to color in as much of the map as possible into their own color.
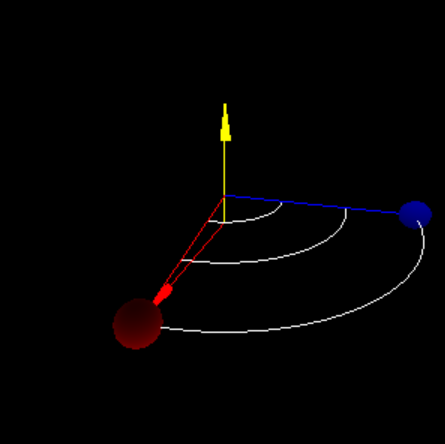
Friendly Robot Arm
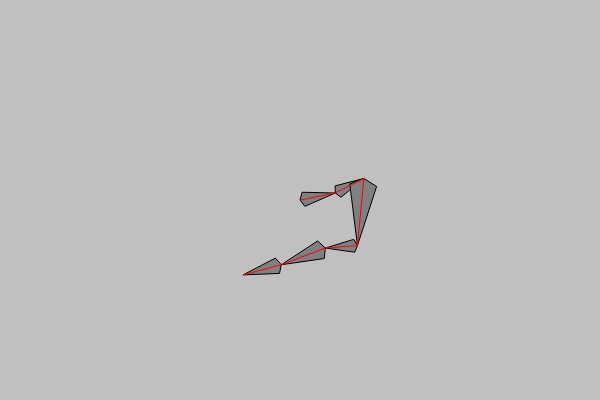
Simulating a robot arm trying to touch the user's cursor using two different inverse kinematik (IK) methods.
Exact pixel collisions of moving objects
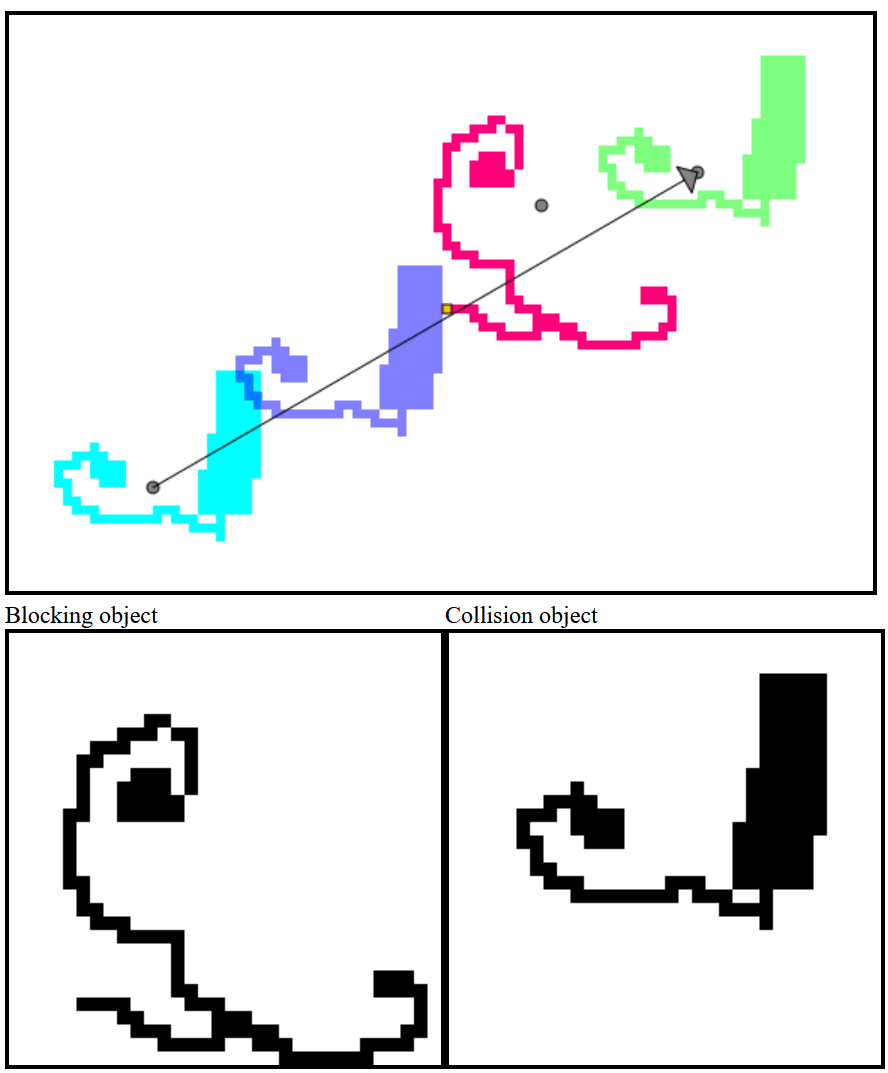
This article shows a way to efficiently compute intersections between pixel objects and collisions when they are moving.
Japanese
Mimetic four mora words
In this article, I gathered mimetic words like くっきり. These words are fun but hard to remember.
Palindromes and Semordnilaps
In this article, I gathered various Japanese palindromes and semordnilaps.
Repeated sounds
In this article, I gathered various Japanese words comprised of repeated sounds, like しばしば